Sankey charts are a type of flow chart used to visualize the flow of data from a given source to a given target. This flow is visualized as "links," the size of which are driven by the corresponding value. The Sankey chart is a good way to visualize the flow of data within a system; for example, you may want to see navigation on your website from 2 different landing pages.
Build a Sankey Chart
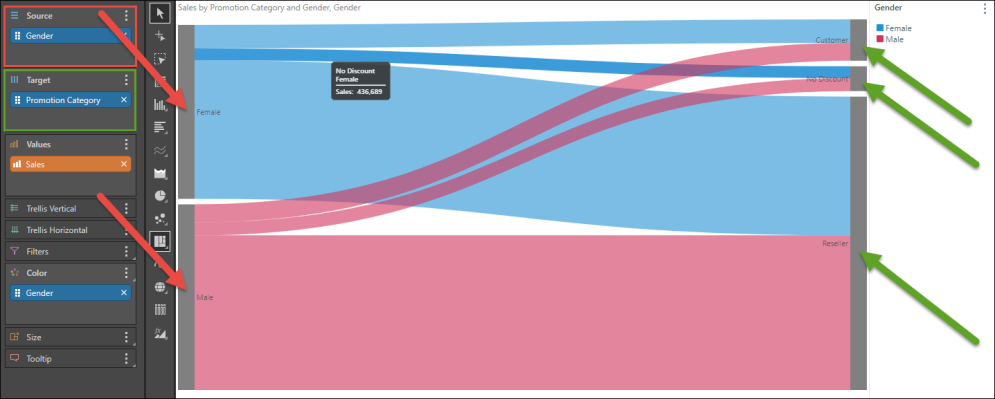
To build a Sankey chart, add 1 blue chip to the Source zone, 1 blue chip to the Target zone, and 1 measure to the Values zone.
In the example below, the Source is the Gender hierarchy (red highlight below). This hierarchy contains two elements (female and male) which are represented by the 2 nodes on the left (red arrows). The Gender hierarchy has also been added to the Color drop zone, to make the visual easier to interpret.
The Target is the Promotion Category hierarchy (green highlight) , which contains three elements represented by the three nodes on the right (green arrows). The links move from left to right (from source to target), showing the flow of sales from gender to promotion category.
Examples
Example 1
Open the Sample Demo model in Discover to follow this example.
Step 1
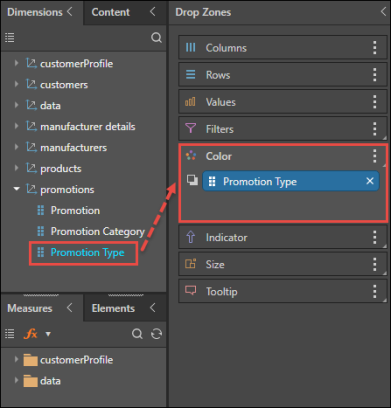
From the Promotions dimension add the Promotion Type hierarchy to the Color drop zone.
Step 2
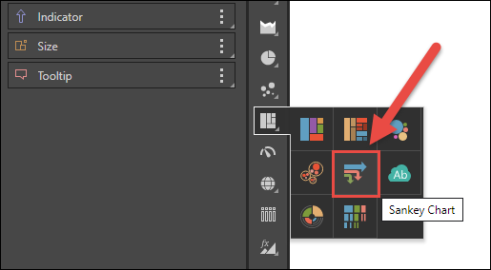
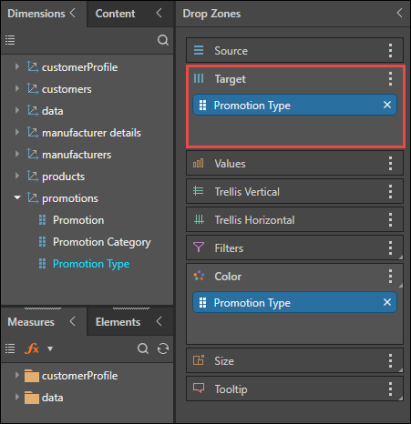
Select Sankey Chart from the Visualization menu.
Step 3
Add Promotion Type to the Target drop zone.
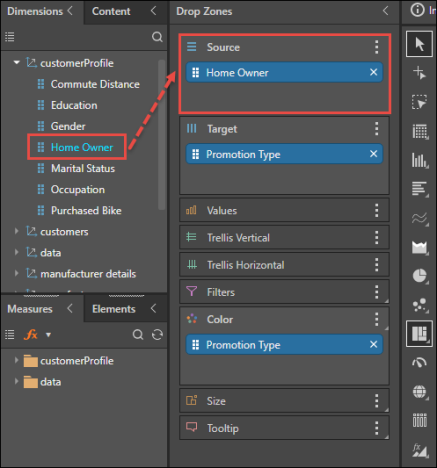
Step 4
Open the Customer Profile dimension and add the Home Owner hierarchy to the Source zone.
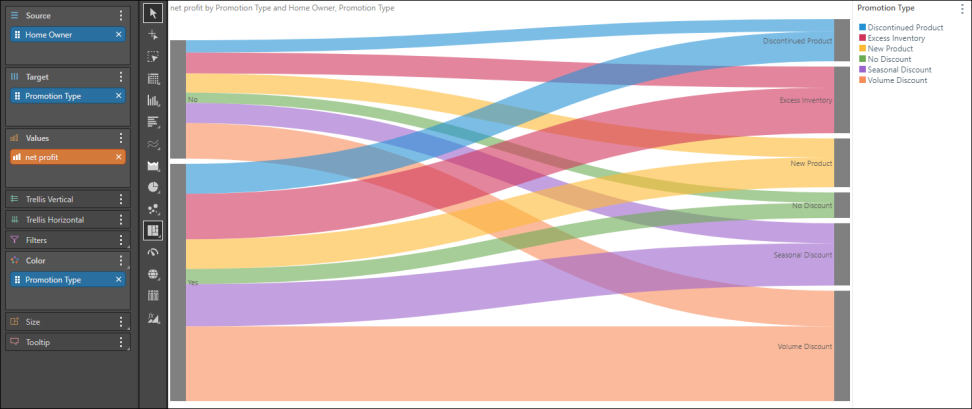
Step 5
Add the Net Profit measure to the Values zone. You'll now see a Sankey chart displaying the flow of net profit from home owner to promotion type; in other words, how much net profit for each promotion type is accounted for by home owners versus non-home owners.
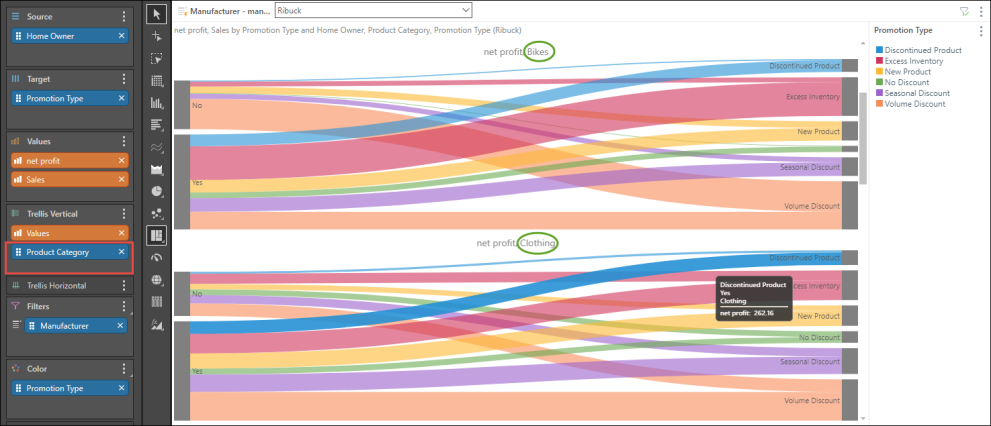
Example 2
This example follows on from Example 1 (above), adding more advanced functionality to the query.
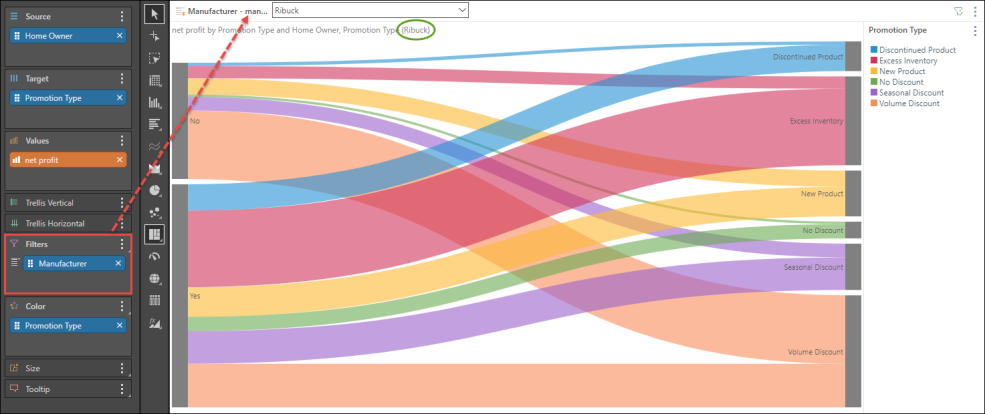
Step 1
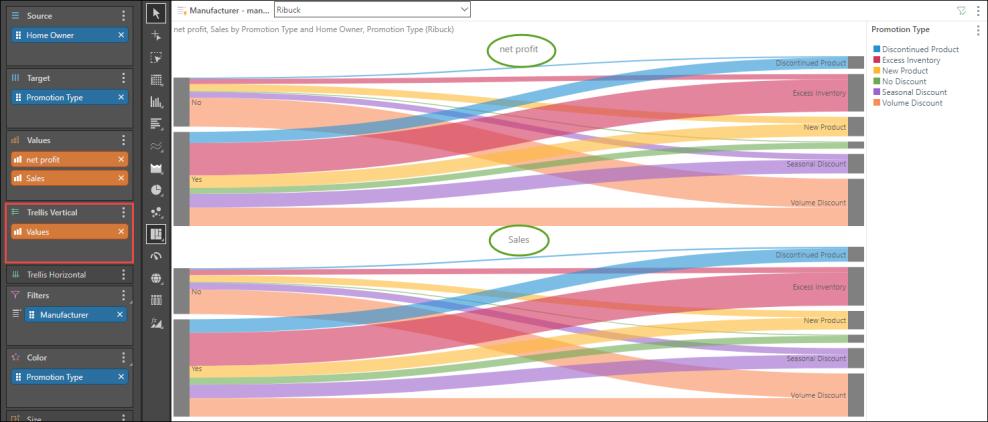
Open the Manufacturers dimension and add the Manufacturer hierarchy to the filters zone; a slicer will be added to the canvas, enabling you to filter the query by manufacturer. The slicer selection will appear in the breadcrumb trail (green highlight).
Step 2
Add the Sales measure to the Trellis Vertical zone to compare net profit with sales.
Step 3
From the Products dimension add Product Category to the Trellis Vertical zone; there will now be a Sankey chart for each product category and value combination.